clc;clear all;close all;
[A,B,C]=xlsread('Correlation_FullDayData.xlsx',1);
ht= A(1,(1:44))';
WindSpeedfreqNewComp_5 =A((2:10),(1:44));
WindSpeedfreqNewComp_8 =A((116:167),(1:44));
WindSpeedfreqNewComp_11 =A((273:324),(1:44));
WindSpeedfreqNewComp_14 =A((430:481),(1:44));
WindSpeedfreqNewComp_17 =A((587:611),(1:44));
[B,C,D]=xlsread('Correlation_FullDayData.xlsx',2);
ZonalfreqNewComp_5 =B((2:10),(1:44));
ZonalfreqNewComp_8 =B((116:167),(1:44));
ZonalfreqNewComp_11 =B((273:324),(1:44));
ZonalfreqNewComp_14 =B((430:481),(1:44));
ZonalfreqNewComp_17 =B((587:611),(1:44));
[C,D,E]=xlsread('Correlation_FullDayData.xlsx',3);
MeridionalfreqNewComp_5 =C((2:10),(1:44));
MeridionalfreqNewComp_8 =C((116:167),(1:44));
MeridionalfreqNewComp_11 =C((273:324),(1:44));
MeridionalfreqNewComp_14 =C((430:481),(1:44));
MeridionalfreqNewComp_17 =C((587:611),(1:44));
[A,B,C]=xlsread('Correlation_FullDayData.xlsx',14);
gpsWindSpeed_5 = A(2,(1:44))';
gpsWindSpeed_8 = A(3,(1:44))';
gpsWindSpeed_11 = A(4,(1:44))';
gpsWindSpeed_14 = A(5,(1:44))';
gpsWindSpeed_17 = A(6,(1:44))';
[A,B,C]=xlsread('Correlation_FullDayData.xlsx',15);
gpsZonal_5 = A(2,(1:44))';
gpsZonal_8 = A(3,(1:44))';
gpsZonal_11 = A(4,(1:44))';
gpsZonal_14 = A(5,(1:44))';
gpsZonal_17 = A(6,(1:44))';
[A,B,C]=xlsread('Correlation_FullDayData.xlsx',16);
gpsMeridional_5 = A(2,(1:44))';
gpsMeridional_8 = A(3,(1:44))';
gpsMeridional_11 = A(4,(1:44))';
gpsMeridional_14 = A(5,(1:44))';
gpsMeridional_17 = A(6,(1:44))';
WindSpeedfreqNewComp_Avg_5=mean(WindSpeedfreqNewComp_5,1)';
WindSpeedfreqNewComp_Avg_8=mean(WindSpeedfreqNewComp_8,1)';
WindSpeedfreqNewComp_Avg_11=mean(WindSpeedfreqNewComp_11,1)';
WindSpeedfreqNewComp_Avg_14=mean(WindSpeedfreqNewComp_14,1)';
WindSpeedfreqNewComp_Avg_17=mean(WindSpeedfreqNewComp_17,1)';
ZonalfreqNewComp_Avg_5=mean(ZonalfreqNewComp_5,1)';
ZonalfreqNewComp_Avg_8=mean(ZonalfreqNewComp_8,1)';
ZonalfreqNewComp_Avg_11=mean(ZonalfreqNewComp_11,1)';
ZonalfreqNewComp_Avg_14=mean(ZonalfreqNewComp_14,1)';
ZonalfreqNewComp_Avg_17=mean(ZonalfreqNewComp_17,1)';
MeridionalfreqNewComp_Avg_5=mean(MeridionalfreqNewComp_5,1)';
MeridionalfreqNewComp_Avg_8=mean(MeridionalfreqNewComp_8,1)';
MeridionalfreqNewComp_Avg_11=mean(MeridionalfreqNewComp_11,1)';
MeridionalfreqNewComp_Avg_14=mean(MeridionalfreqNewComp_14,1)';
MeridionalfreqNewComp_Avg_17=mean(MeridionalfreqNewComp_17,1)';
WindSpeedfreqNewComp_Std_5=std(WindSpeedfreqNewComp_5,1)';
WindSpeedfreqNewComp_Std_8=std(WindSpeedfreqNewComp_8,1)';
WindSpeedfreqNewComp_Std_11=std(WindSpeedfreqNewComp_11,1)';
WindSpeedfreqNewComp_Std_14=std(WindSpeedfreqNewComp_14,1)';
WindSpeedfreqNewComp_Std_17=std(WindSpeedfreqNewComp_17,1)';
ZonalfreqNewComp_Std_5=std(ZonalfreqNewComp_5,1)';
ZonalfreqNewComp_Std_8=std(ZonalfreqNewComp_8,1)';
ZonalfreqNewComp_Std_11=std(ZonalfreqNewComp_11,1)';
ZonalfreqNewComp_Std_14=std(ZonalfreqNewComp_14,1)';
ZonalfreqNewComp_Std_17=std(ZonalfreqNewComp_17,1)';
MeridionalfreqNewComp_Std_5=std(MeridionalfreqNewComp_5,1)';
MeridionalfreqNewComp_Std_8=std(MeridionalfreqNewComp_8,1)';
MeridionalfreqNewComp_Std_11=std(MeridionalfreqNewComp_11,1)';
MeridionalfreqNewComp_Std_14=std(MeridionalfreqNewComp_14,1)';
MeridionalfreqNewComp_Std_17=std(MeridionalfreqNewComp_17,1)';
UVW_Validation=figure(1); set(UVW_Validation, 'PaperType', 'a4'); set(UVW_Validation, 'PaperOrientation', 'portrait');
set(UVW_Validation, 'Resize', 'on');set(UVW_Validation, 'Position',[0 0 2480*(80/100) 3508*(80/100)]);
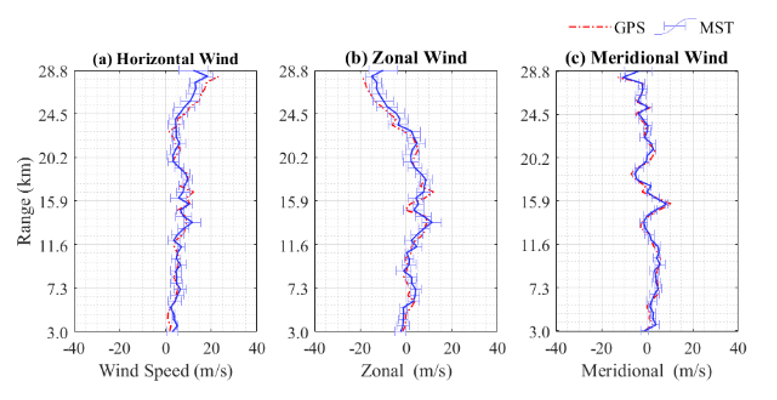
subplot(3,3,4);
b = plot(gpsWindSpeed_5,ht,'-.r', 'LineWidth', 1);
hold on;
errorbar(WindSpeedfreqNewComp_Avg_5, ht, WindSpeedfreqNewComp_Std_5, 'horizontal', 'color', '#9696FA', 'LineWidth', .35);
a = plot(WindSpeedfreqNewComp_Avg_5,ht,'color','#1E28FA', 'LineWidth', 1);
axis tight;
x = xlabel('Wind Speed (m/s)','FontSize', 12, 'FontName','Times New Roman', 'FontWeight', 'Normal');
x.FontSize = 12;
xlim([-40, 40]);x.FontWeight = 'Normal';
y = ylabel('Range (km)','FontSize', 12, 'FontName','Times New Roman', 'FontWeight', 'Normal');
y.FontSize = 12;
y.FontWeight = 'Normal';
set(gca, 'YTick', linspace( (min(ht)), (max(ht)), 7));
set(gca,'FontSize', 12, 'FontName','Times New Roman', 'FontWeight', 'Normal');
ytickformat('%.1f');
t= title('(a) Horizontal Wind','FontSize',12,'FontName','Times New Roman', 'FontWeight', 'bold','HorizontalAlignment',"center");
grid minor; grid on; box on;
hold off;
subplot(3,3,5);
plot(gpsZonal_5,ht,'-.r', 'LineWidth', 1);
hold on;
errorbar(ZonalfreqNewComp_Avg_5, ht, ZonalfreqNewComp_Std_5, 'horizontal', 'color', '#9696FA', 'LineWidth', .35);
plot(ZonalfreqNewComp_Avg_5,ht,'color','#1E28FA', 'LineWidth', 1);
axis tight;
x = xlabel('Zonal (m/s)','FontSize', 12, 'FontName','Times New Roman', 'FontWeight', 'Normal');
t= title('(b) Zonal Wind','FontSize',12,'FontName','Times New Roman', 'FontWeight', 'bold','HorizontalAlignment',"center");
xlim([-40, 40]);x.FontWeight = 'Normal';
set(gca, 'YTick', linspace( (min(ht)), (max(ht)), 7));
set(gca,'FontSize', 12, 'FontName','Times New Roman', 'FontWeight', 'Normal');
ytickformat('%.1f');
grid minor; grid on; box on;
hold off;
subplot(3,3,6);
plot(gpsMeridional_5,ht,'-.r', 'LineWidth', 1);
hold on;
errorbar(MeridionalfreqNewComp_Avg_5, ht, MeridionalfreqNewComp_Std_5, 'horizontal', 'color', '#9696FA', 'LineWidth', .35);
plot(MeridionalfreqNewComp_Avg_5,ht,'color','#1E28FA', 'LineWidth', 1);
t= title('(c) Meridional Wind','FontSize',12,'FontName','Times New Roman', 'FontWeight', 'bold','HorizontalAlignment',"center");
x = xlabel('Meridional (m/s)','FontSize', 12, 'FontName','Times New Roman', 'FontWeight', 'Normal');
x.FontSize = 12;
xlim([-40, 40]);x.FontWeight = 'Normal';
ylim([2.9, 28.9]);y.FontWeight = 'Normal';
set(gca, 'YTick', linspace( (min(ht)), (max(ht)), 7));
set(gca,'FontSize', 12, 'FontName','Times New Roman', 'FontWeight', 'Normal');
ytickformat('%.1f');
grid minor; grid on; box on;
set(gca,'FontSize', 12, 'FontName','Times New Roman', 'FontWeight', 'Normal');
str='Validation of mean wind derived using eBayes with GPS';
T = text(min(get(gca, 'xlim')), max(get(gca, 'ylim')), str);
set(T,'position',[-109.7189562789874,120.3382829480026,0],'FontSize', 12, ...
"VerticalAlignment","top","HorizontalAlignment","left",'FontName','Times New Roman', 'FontWeight', 'bold','color','#000000');
legend ({'GPS', 'MST'},"Location","none","Orientation","horizontal","Box","off", ...
"FontSize",12,'FontName','Times New Roman','Position',[0.718045163912454 0.651490883558266 0.171085337103154 0.020740741146935]);
hold off;
UVW_Validation=figure(2); set(UVW_Validation, 'PaperType', 'a4'); set(UVW_Validation, 'PaperOrientation', 'portrait');
set(UVW_Validation, 'Resize', 'on');set(UVW_Validation, 'Position',[0 0 2480*(80/100) 3508*(80/100)]);
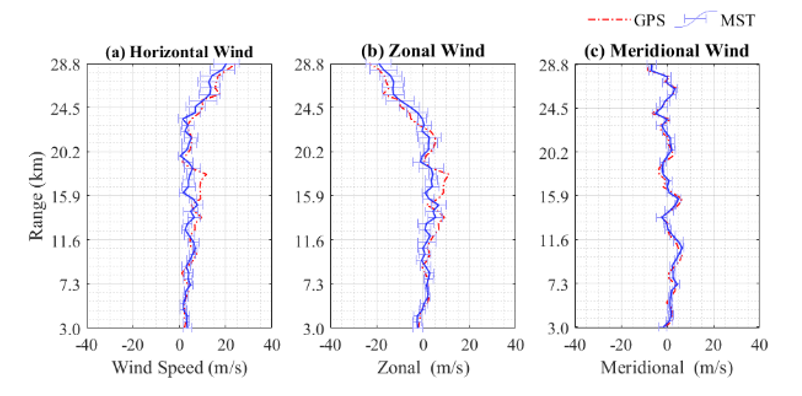
subplot(3,3,4);
b = plot(gpsWindSpeed_8,ht,'-.r', 'LineWidth', 1);
hold on;
errorbar(WindSpeedfreqNewComp_Avg_8, ht, WindSpeedfreqNewComp_Std_8, 'horizontal', 'color', '#9696FA', 'LineWidth', .35);
a = plot(WindSpeedfreqNewComp_Avg_8,ht,'color','#1E28FA', 'LineWidth', 1);
axis tight;
x = xlabel('Wind Speed (m/s)','FontSize', 12, 'FontName','Times New Roman', 'FontWeight', 'Normal');
x.FontSize = 12;
xlim([-40, 40]);x.FontWeight = 'Normal';
y = ylabel('Range (km)','FontSize', 12, 'FontName','Times New Roman', 'FontWeight', 'Normal');
y.FontSize = 12;
y.FontWeight = 'Normal';
set(gca, 'YTick', linspace( (min(ht)), (max(ht)), 7));
set(gca,'FontSize', 12, 'FontName','Times New Roman', 'FontWeight', 'Normal');
ytickformat('%.1f');
t= title('(a) Horizontal Wind','FontSize',12,'FontName','Times New Roman', 'FontWeight', 'bold','HorizontalAlignment',"center");
grid minor; grid on; box on;
hold off;
subplot(3,3,5);
plot(gpsZonal_8,ht,'-.r', 'LineWidth', 1);
hold on;
errorbar(ZonalfreqNewComp_Avg_8, ht, ZonalfreqNewComp_Std_8, 'horizontal', 'color', '#9696FA', 'LineWidth', .35);
plot(ZonalfreqNewComp_Avg_8,ht,'color','#1E28FA', 'LineWidth', 1);
axis tight;
x = xlabel('Zonal (m/s)','FontSize', 12, 'FontName','Times New Roman', 'FontWeight', 'Normal');
x.FontSize = 12;
t= title('(b) Zonal Wind','FontSize',12,'FontName','Times New Roman', 'FontWeight', 'bold','HorizontalAlignment',"center");
xlim([-40, 40]);x.FontWeight = 'Normal';
set(gca, 'YTick', linspace( (min(ht)), (max(ht)), 7));
set(gca,'FontSize', 12, 'FontName','Times New Roman', 'FontWeight', 'Normal');
ytickformat('%.1f');
grid minor; grid on; box on;
hold off;
subplot(3,3,6);
plot(gpsMeridional_8,ht,'-.r', 'LineWidth', 1);
hold on;
errorbar(MeridionalfreqNewComp_Avg_8, ht, MeridionalfreqNewComp_Std_8, 'horizontal', 'color', '#9696FA', 'LineWidth', .35);
plot(MeridionalfreqNewComp_Avg_8,ht,'color','#1E28FA', 'LineWidth', 1);
t= title('(c) Meridional Wind','FontSize',12,'FontName','Times New Roman', 'FontWeight', 'bold','HorizontalAlignment',"center");
x = xlabel('Meridional (m/s)','FontSize', 12, 'FontName','Times New Roman', 'FontWeight', 'Normal');
x.FontSize = 12;
xlim([-40, 40]);x.FontWeight = 'Normal';
ylim([2.9, 28.9]);y.FontWeight = 'Normal';
set(gca, 'YTick', linspace( (min(ht)), (max(ht)), 7));
set(gca,'FontSize', 12, 'FontName','Times New Roman', 'FontWeight', 'Normal');
ytickformat('%.1f');
grid minor; grid on; box on;
set(gca,'FontSize', 12, 'FontName','Times New Roman', 'FontWeight', 'Normal');
str='Validation of mean wind derived using eBayes with GPS';
T = text(min(get(gca, 'xlim')), max(get(gca, 'ylim')), str);
set(T,'position',[-109.7189562789874,120.3382829480026,0],'FontSize', 12, ...
"VerticalAlignment","top","HorizontalAlignment","left",'FontName','Times New Roman', 'FontWeight', 'bold','color','#000000');
legend ({'GPS', 'MST'},"Location","none","Orientation","horizontal","Box","off","FontSize",12, ...
'FontName','Times New Roman','Position',[0.718045163912454 0.651490883558266 0.171085337103154 0.020740741146935]);
hold off;
UVW_Validation=figure(3); set(UVW_Validation, 'PaperType', 'a4'); set(UVW_Validation, 'PaperOrientation', 'portrait');
set(UVW_Validation, 'Resize', 'on');set(UVW_Validation, 'Position',[0 0 2480*(80/100) 3508*(80/100)]);
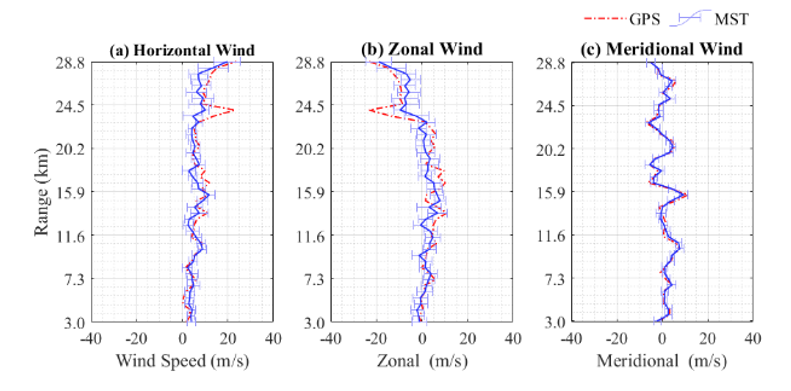
subplot(3,3,4);
b = plot(gpsWindSpeed_11,ht,'-.r', 'LineWidth', 1);
hold on;
errorbar(WindSpeedfreqNewComp_Avg_11, ht, WindSpeedfreqNewComp_Std_11, 'horizontal', 'color', '#9696FA', 'LineWidth', .35);
a = plot(WindSpeedfreqNewComp_Avg_11,ht,'color','#1E28FA', 'LineWidth', 1);
axis tight;
x = xlabel('Wind Speed (m/s)','FontSize', 12, 'FontName','Times New Roman', 'FontWeight', 'Normal');
x.FontSize = 12;
xlim([-40, 40]);x.FontWeight = 'Normal';
y = ylabel('Range (km)','FontSize', 12, 'FontName','Times New Roman', 'FontWeight', 'Normal');
y.FontSize = 12;
y.FontWeight = 'Normal';
set(gca, 'YTick', linspace( (min(ht)), (max(ht)), 7));
set(gca,'FontSize', 12, 'FontName','Times New Roman', 'FontWeight', 'Normal');
ytickformat('%.1f');
t= title('(a) Horizontal Wind','FontSize',12,'FontName','Times New Roman', 'FontWeight', 'bold','HorizontalAlignment',"center");
grid minor; grid on; box on;
hold off;
subplot(3,3,5);
plot(gpsZonal_11,ht,'-.r', 'LineWidth', 1);
hold on;
errorbar(ZonalfreqNewComp_Avg_11, ht, ZonalfreqNewComp_Std_11, 'horizontal', 'color', '#9696FA', 'LineWidth', .35);
plot(ZonalfreqNewComp_Avg_11,ht,'color','#1E28FA', 'LineWidth', 1);
axis tight;
x = xlabel('Zonal (m/s)','FontSize', 12, 'FontName','Times New Roman', 'FontWeight', 'Normal');
x.FontSize = 12;
t= title('(b) Zonal Wind','FontSize',12,'FontName','Times New Roman', 'FontWeight', 'bold','HorizontalAlignment',"center");
xlim([-40, 40]);x.FontWeight = 'Normal';
set(gca, 'YTick', linspace( (min(ht)), (max(ht)), 7));
set(gca,'FontSize', 12, 'FontName','Times New Roman', 'FontWeight', 'Normal');
ytickformat('%.1f');
grid minor; grid on; box on;
hold off;
subplot(3,3,6);
plot(gpsMeridional_11,ht,'-.r', 'LineWidth', 1);
hold on;
errorbar(MeridionalfreqNewComp_Avg_11, ht, MeridionalfreqNewComp_Std_11, 'horizontal', 'color', '#9696FA', 'LineWidth', .35);
plot(MeridionalfreqNewComp_Avg_11,ht,'color','#1E28FA', 'LineWidth', 1);
t= title('(c) Meridional Wind','FontSize',12,'FontName','Times New Roman', 'FontWeight', 'bold','HorizontalAlignment',"center");
x = xlabel('Meridional (m/s)','FontSize', 12, 'FontName','Times New Roman', 'FontWeight', 'Normal');
x.FontSize = 12;
xlim([-40, 40]);x.FontWeight = 'Normal';
ylim([2.9, 28.9]);y.FontWeight = 'Normal';
set(gca, 'YTick', linspace( (min(ht)), (max(ht)), 7));
set(gca,'FontSize', 12, 'FontName','Times New Roman', 'FontWeight', 'Normal');
ytickformat('%.1f');
grid minor; grid on; box on;
set(gca,'FontSize', 12, 'FontName','Times New Roman', 'FontWeight', 'Normal');
str='Validation of mean wind derived using eBayes with GPS';
T = text(min(get(gca, 'xlim')), max(get(gca, 'ylim')), str);
set(T,'position',[-109.7189562789874,120.3382829480026,0],'FontSize', 12, ...
"VerticalAlignment","top","HorizontalAlignment","left",'FontName','Times New Roman', 'FontWeight', 'bold','color','#000000');
legend ({'GPS', 'MST'},"Location","none","Orientation","horizontal","Box","off","FontSize",12, ...
'FontName','Times New Roman','Position',[0.718045163912454 0.651490883558266 0.171085337103154 0.020740741146935]);
hold off;
-->
UVW_Validation=figure(4); set(UVW_Validation, 'PaperType', 'a4'); set(UVW_Validation, 'PaperOrientation', 'portrait');
set(UVW_Validation, 'Resize', 'on');set(UVW_Validation, 'Position',[0 0 2480*(80/100) 3508*(80/100)]);
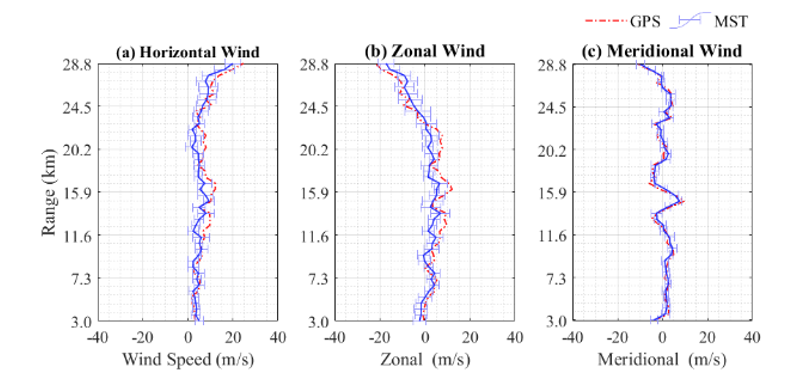
subplot(3,3,4);
b = plot(gpsWindSpeed_14,ht,'-.r', 'LineWidth', 1);
hold on;
errorbar(WindSpeedfreqNewComp_Avg_14, ht, WindSpeedfreqNewComp_Std_14, 'horizontal', 'color', '#9696FA', 'LineWidth', .35);
a = plot(WindSpeedfreqNewComp_Avg_14,ht,'color','#1E28FA', 'LineWidth', 1);
axis tight;
x = xlabel('Wind Speed (m/s)','FontSize', 12, 'FontName','Times New Roman', 'FontWeight', 'Normal');
x.FontSize = 12;
xlim([-40, 40]);x.FontWeight = 'Normal';
y = ylabel('Range (km)','FontSize', 12, 'FontName','Times New Roman', 'FontWeight', 'Normal');
y.FontSize = 12;
y.FontWeight = 'Normal';
set(gca, 'YTick', linspace( (min(ht)), (max(ht)), 7));
set(gca,'FontSize', 12, 'FontName','Times New Roman', 'FontWeight', 'Normal');
ytickformat('%.1f');
t= title('(a) Horizontal Wind','FontSize',12,'FontName','Times New Roman', 'FontWeight', 'bold','HorizontalAlignment',"center");
grid minor; grid on; box on;
hold off;
subplot(3,3,5);
plot(gpsZonal_14,ht,'-.r', 'LineWidth', 1);
hold on;
errorbar(ZonalfreqNewComp_Avg_14, ht, ZonalfreqNewComp_Std_14, 'horizontal', 'color', '#9696FA', 'LineWidth', .35);
plot(ZonalfreqNewComp_Avg_14,ht,'color','#1E28FA', 'LineWidth', 1);
axis tight;
x = xlabel('Zonal (m/s)','FontSize', 12, 'FontName','Times New Roman', 'FontWeight', 'Normal');
x.FontSize = 12;
t= title('(b) Zonal Wind','FontSize',12,'FontName','Times New Roman', 'FontWeight', 'bold','HorizontalAlignment',"center");
xlim([-40, 40]);x.FontWeight = 'Normal';
set(gca, 'YTick', linspace( (min(ht)), (max(ht)), 7));
set(gca,'FontSize', 12, 'FontName','Times New Roman', 'FontWeight', 'Normal');
ytickformat('%.1f');
grid minor; grid on; box on;
hold off;
subplot(3,3,6);
plot(gpsMeridional_14,ht,'-.r', 'LineWidth', 1);
hold on;
errorbar(MeridionalfreqNewComp_Avg_14, ht, MeridionalfreqNewComp_Std_14, 'horizontal', 'color', '#9696FA', 'LineWidth', .35);
plot(MeridionalfreqNewComp_Avg_14,ht,'color','#1E28FA', 'LineWidth', 1);
t= title('(c) Meridional Wind','FontSize',12,'FontName','Times New Roman', 'FontWeight', 'bold','HorizontalAlignment',"center");
x = xlabel('Meridional (m/s)','FontSize', 12, 'FontName','Times New Roman', 'FontWeight', 'Normal');
x.FontSize = 12;
xlim([-40, 40]);x.FontWeight = 'Normal';
ylim([2.9, 28.9]);y.FontWeight = 'Normal';
set(gca, 'YTick', linspace( (min(ht)), (max(ht)), 7));
set(gca,'FontSize', 12, 'FontName','Times New Roman', 'FontWeight', 'Normal');
ytickformat('%.1f');
grid minor; grid on; box on;
set(gca,'FontSize', 12, 'FontName','Times New Roman', 'FontWeight', 'Normal');
str='Validation of mean wind derived using eBayes with GPS';
T = text(min(get(gca, 'xlim')), max(get(gca, 'ylim')), str);
set(T,'position',[-109.7189562789874,120.3382829480026,0],'FontSize', 12, ...
"VerticalAlignment","top","HorizontalAlignment","left",'FontName','Times New Roman', 'FontWeight', 'bold','color','#000000');
legend ({'GPS', 'MST'},"Location","none","Orientation","horizontal","Box","off","FontSize",12, ...
'FontName','Times New Roman','Position',[0.718045163912454 0.651490883558266 0.171085337103154 0.020740741146935]);
hold off;
UVW_Validation=figure(5); set(UVW_Validation, 'PaperType', 'a4'); set(UVW_Validation, 'PaperOrientation', 'portrait');
set(UVW_Validation, 'Resize', 'on');set(UVW_Validation, 'Position',[0 0 2480*(80/100) 3508*(80/100)]);
subplot(3,3,4);
b = plot(gpsWindSpeed_17,ht,'-.r', 'LineWidth', 1);
hold on;
errorbar(WindSpeedfreqNewComp_Avg_17, ht, WindSpeedfreqNewComp_Std_17, 'horizontal', 'color', '#9696FA', 'LineWidth', .35);
a = plot(WindSpeedfreqNewComp_Avg_17,ht,'color','#1E28FA', 'LineWidth', 1);
axis tight;
x = xlabel('Wind Speed (m/s)','FontSize', 12, 'FontName','Times New Roman', 'FontWeight', 'Normal');
x.FontSize = 12;
xlim([-40, 40]);x.FontWeight = 'Normal';
y = ylabel('Range (km)','FontSize', 12, 'FontName','Times New Roman', 'FontWeight', 'Normal');
y.FontSize = 12;
y.FontWeight = 'Normal';
set(gca, 'YTick', linspace( (min(ht)), (max(ht)), 7));
set(gca,'FontSize', 12, 'FontName','Times New Roman', 'FontWeight', 'Normal');
ytickformat('%.1f');
MSTTitle = strcat('MST: 25-Dec-2019( ', '17:01:25', '-', '17:27:48', ') ');
GPSTitle = strcat('GPS: (','17:30:00',') ');
t= title('(a) Horizontal Wind','FontSize',12,'FontName','Times New Roman', 'FontWeight', 'bold','HorizontalAlignment',"center");
grid minor; grid on; box on;
hold off;
subplot(3,3,5);
plot(gpsZonal_17,ht,'-.r', 'LineWidth', 1);
hold on;
errorbar(ZonalfreqNewComp_Avg_17, ht, ZonalfreqNewComp_Std_17, 'horizontal', 'color', '#9696FA', 'LineWidth', .35);
plot(ZonalfreqNewComp_Avg_17,ht,'color','#1E28FA', 'LineWidth', 1);
axis tight;
x = xlabel('Zonal (m/s)','FontSize', 12, 'FontName','Times New Roman', 'FontWeight', 'Normal');
x.FontSize = 12;
t= title('(b) Zonal Wind','FontSize',12,'FontName','Times New Roman', 'FontWeight', 'bold','HorizontalAlignment',"center");
xlim([-40, 40]);x.FontWeight = 'Normal';
set(gca, 'YTick', linspace( (min(ht)), (max(ht)), 7));
set(gca,'FontSize', 12, 'FontName','Times New Roman', 'FontWeight', 'Normal');
ytickformat('%.1f');
grid minor; grid on; box on;
hold off;
subplot(3,3,6);
plot(gpsMeridional_17,ht,'-.r', 'LineWidth', 1);
hold on;
errorbar(MeridionalfreqNewComp_Avg_17, ht, MeridionalfreqNewComp_Std_17, 'horizontal', 'color', '#9696FA', 'LineWidth', .35);
plot(MeridionalfreqNewComp_Avg_17,ht,'color','#1E28FA', 'LineWidth', 1);
t= title('(c) Meridional Wind','FontSize',12,'FontName','Times New Roman', 'FontWeight', 'bold','HorizontalAlignment',"center");
x = xlabel('Meridional (m/s)','FontSize', 12, 'FontName','Times New Roman', 'FontWeight', 'Normal');
x.FontSize = 12;
xlim([-40, 40]);x.FontWeight = 'Normal';
ylim([2.9, 28.9]);y.FontWeight = 'Normal';
set(gca, 'YTick', linspace( (min(ht)), (max(ht)), 7));
set(gca,'FontSize', 12, 'FontName','Times New Roman', 'FontWeight', 'Normal');
ytickformat('%.1f');
grid minor; grid on; box on;
set(gca,'FontSize', 12, 'FontName','Times New Roman', 'FontWeight', 'Normal');
str='Validation of mean wind derived using eBayes with GPS';
T = text(min(get(gca, 'xlim')), max(get(gca, 'ylim')), str);
set(T,'position',[-109.7189562789874,120.3382829480026,0],'FontSize', 12, ...
"VerticalAlignment","top","HorizontalAlignment","left",'FontName','Times New Roman', 'FontWeight', 'bold','color','#000000');
legend ({'GPS', 'MST'},"Location","none","Orientation","horizontal","Box","off","FontSize",12, ...
'FontName','Times New Roman','Position',[0.718045163912454 0.651490883558266 0.171085337103154 0.020740741146935]);
hold off;
